
Carrot CRM is your new partner in simplifying real estate lead management!
Did you know? Carrot CRM’s Essential, Scale and Team plans come with included setup support. Our team handles setting up lead integrations for you during a simple kickoff call.
Introduction
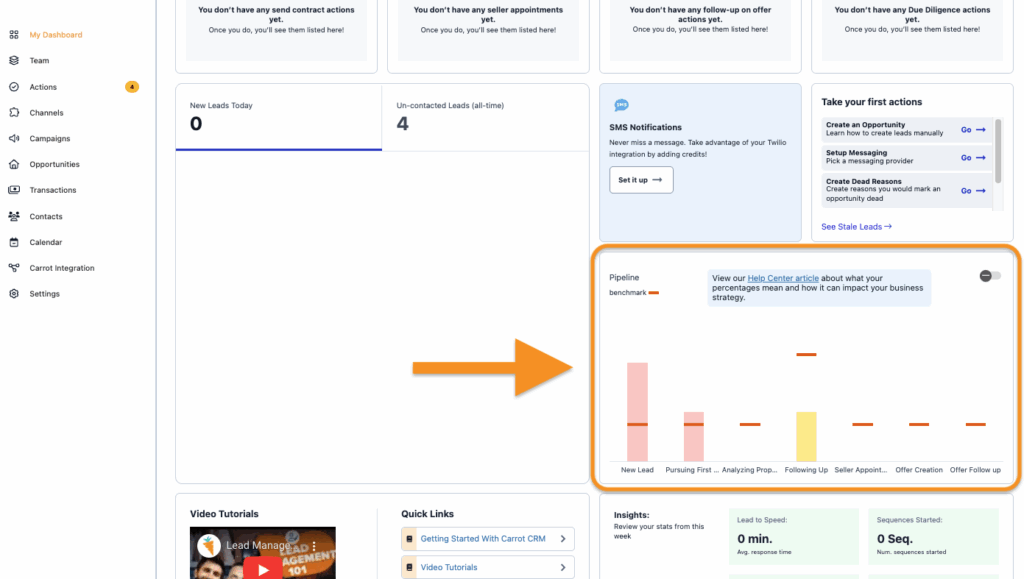
Inside your main Carrot CRM dashboard, you’ll find a snapshot of your Pipeline. The Pipeline shows you the status of opportunities where you are the opportunity owner.
The idea behind this Pipeline view is to let you compare where your opportunities are at compared to a benchmark of our top performing users. The benchmark lines show you what a healthy pipeline looks like and then what your pipeline looks like in comparison to it.
How Benchmarks Are Calculated
The benchmark is a KPI for how many leads are moved from one status to another throughout that day, distributed throughout the number of opportunities in the team and totalling to 100%.
The percentage calculation is based on the metrics below:
- Call Lead – 6
- Call Attempt
- Due Dilligence-Pursue – 10
- Follow-up – 1
- Seller Appointment – 71
- Make Offer – 1
- Follow Up on Offer – 9
For every 100 leads in a team, the percentage calculation for the benchmark will use the table above, so that if a team has 3 Leads under Call Lead today instead of 6, the dashboard will mark it as 50% because that is half the total of the benchmark.
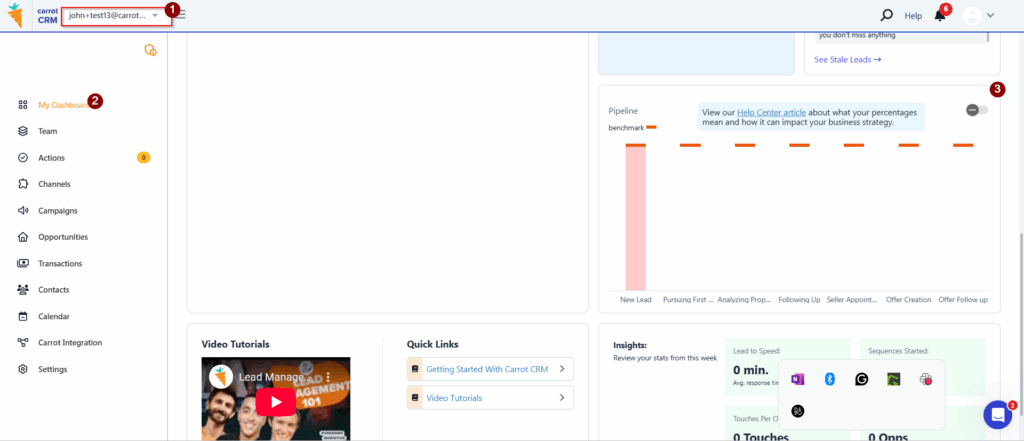
To Access Pipeline Dashboard
- Select CRM Team
- Click on Dashboard
- Scroll down to Pipeline dashboard
🚨 IMPORTANT: The percentage calculation is static but prorates accordingly to the number of total opportunities.