Every Carrot website comes with built-in analytics so you can see which pages are most viewed, where visitors are coming from, and what pages are converting your visitors into leads.
Our Analytics dashboard helps you track your website traffic and understand how visitors interact with your site, so you can optimize for better performance.
In this tutorial, we’ll show you what your Analytics dashboard includes and how you can use this data to improve your site.
What’s Included in Carrot’s Analytics
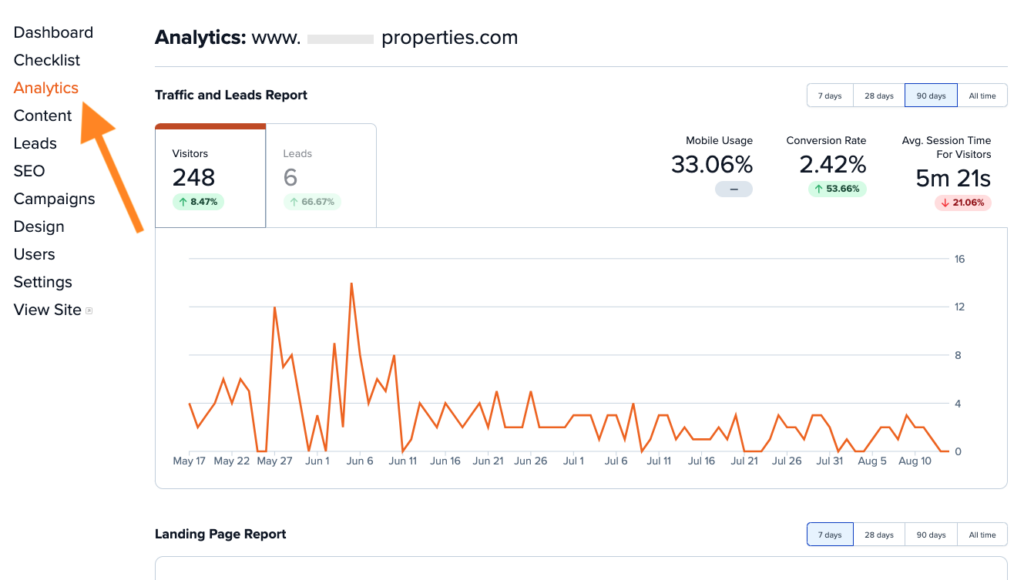
You can access your Analytics by clicking Analytics in the navigation menu on the left side of your Carrot dashboard:

Inside your Analytics dashboard, you’ll find three helpful reports:
- Traffic and Leads Report
- Landing Page Report
- Traffic Source Report
Traffic and Leads Report
This report provides an overview of how much traffic your website is getting and how many leads you’ve brought in during a given time period.
You’ll also see an overview of:
- Mobile Usage – The percentage of users who visited your website from a mobile device.
- Conversion Rate – The percentage of website visitors who converted to become a lead.
- Avg. Session Time For Visitors – The average amount of time visitors spent on your website during a single session.
By default, the report will show you the last 7 days of traffic. At the top right of the report, you can toggle between time periods of the last 7, 28, or 90 days or view All time.
You’ll see the number of website Visitors during the selected time period displayed in orange at the top left of the report and on the orange line graph.
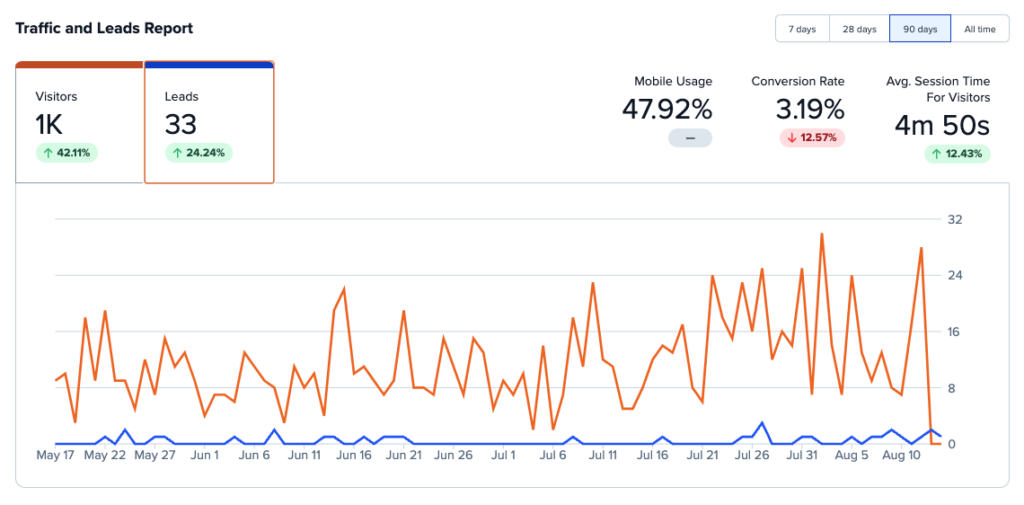
You can click Leads at the top left to also see a blue line graph showing the dates of when leads came in via your website:

Landing Page Report
This report shows you the top pages that visitors see first when they land on your site, and how many visitors land on each page.
This is one of our favorite reports to identify opportunities for improvement (more on that below).
ℹ️ Note: The Landing Page Report can include posts or pages from throughout your site, including (but not limited to) pages created with Carrot’s Landing Pages feature.
By default, the report will show you the last 7 days of traffic. At the top right of the report, you can toggle between time periods of the last 7, 28, or 90 days or view All time.
You’ll see the following information for each page:
- Visitors – How many visitors landed on that page during the given time period.
- Page views per visitor – How many pages a user views on average during a single visit to your website.
- Avg. engagement time per session – The average engagement time per session for visitors who land on that page. During their session, the visitor may also visit other pages, but this metric is a good measure of how engaging the page they landed on is.
- Conversions – The number of conversions (leads) attributed to a specific page.
- Conversion rate – The percentage of visitors who landed on that page and converted to become a lead.

Traffic Source Report
This report shows you the different sources of website traffic.
A few traffic sources commonly found in this report include:
- Direct – Website visits where the traffic source is unknown or not tracked. Examples of direct traffic may include visitors who land on your website after typing your URL directly into their browser, or visitors who get to your website via “dark social” mentions like clicking a link shared within a private messenger app.
- Organic – Traffic that comes from unpaid search results in search engines like Google, Bing, or Yahoo.
- Referral – Traffic that arrives on your website through another source, like through a backlink from someone else’s website.
By default, the report will show you the last 7 days of traffic. At the top right of the report, you can toggle between time periods of the last 7, 28, or 90 days or view All time.

How to Interpret and Use This Data
The data found in your Analytics dashboard can be a goldmine of actionable insights. Here are 5 tips for how to use this data to guide website optimizations and SEO improvements:
1. Focus on the Big Picture
SEO and evergreen marketing is an ongoing process. We recommend looking at trends over longer time periods, like month over month and quarter over quarter, rather than focusing on changes in traffic or keyword rankings on a daily or weekly basis.
You can look at your Analytics for the last 7, 28, 90 days or all time.
We recommend focusing mostly on either the last 28 or 90 days to get a big picture sense of what pages have been bringing in traffic and leads most recently.
Set up a routine to check your Analytics and other website performance reports monthly or quarterly. Consistent monitoring helps you stay on top of trends and make timely adjustments.
2. Set Website Goals Aligned With Your Business Goals
Use the metrics found in your Analytics to set specific, measurable goals for your website, and make sure to align your website goals with your overall marketing and business goals.
First, consider your overall business goals and identify what you want to achieve overall (e.g., increase revenue, boost brand awareness, grow the number of customers or leads). Then, determine your most important marketing goals.
If your website or business is new, you may want to focus mostly on increasing website traffic. SEO takes time to build, so you may want to consider running paid ads to increase website traffic during the early stages.
Once you’ve established consistent website traffic and search engine rankings, you may want to focus on improving conversion rates, to turn more of those website visitors into customers or clients.
3. Analyze and Interpret Data
Look for patterns or trends in the data over time.
For instance, if you notice a significant drop in traffic from a particular source, it may indicate an issue with that marketing channel. On the other hand, it could reflect seasonal changes or a shifting industry landscape.
An annual dip in website traffic during seasons like summer or the December holidays can be completely normal. It’s important to consider outside influences that may impact changes in website traffic.
If you see a spike in traffic or leads, can you identify what caused it?
You may be able to pinpoint the reason based on data found in your Analytics dashboard, or it could have something to do with your offline marketing efforts like tv ads or a recent mention in the press.
4. Double Down on What’s Working and Improve What’s Not
The Landing Page Report provides an overview of what pages or posts are bringing in the most traffic and conversions. This is one of our favorite reports to identify opportunities for improvement:
- Identify Top-Performing Pages: Look at pages with high visitor numbers and engagement times. These are likely your most popular and engaging content.
- Improve Underperforming Pages: If some top pages have low engagement or low conversion rates, consider updating their content, design, or call-to-action to make them more appealing.
- Optimize for Conversions: Check which pages have the highest conversion rates and analyze what makes them successful. Try to replicate these elements on other pages.
You can double down on what’s working by continuing to improve top performing pages. You can also replicate what’s working by adjusting underperforming pages.
On pages that are getting traffic, are there opportunities to add more mentions about the specific location or market area your business is focused on? This could help you get found in more location specific search results.
To improve credibility and conversions, is there opportunity to add more details about the ways you help people with a specific problem? Could you include case studies or add more reviews or testimonials?
If your conversion rate is low, review your calls-to-action, forms, and overall user experience. Improving these can boost conversions and ultimately, rankings.
Pay attention to engagement metrics. Longer session times generally indicate that users find your content engaging. If your session times are short, it might mean your content isn’t resonating with visitors. Try improving the quality and relevance of your content to keep visitors on your site longer.
For pages with a lot of traffic but low engagement time, it may make sense to add relevant video content, answer related questions, or adjust the layout of the content to improve the user experience of the content on the page.
(On the other hand, if a page has low engagement time but a high conversion rate, visitors may be getting exactly what they need quickly!)
5. Experiment and Adjust
Based on your analysis, make changes to your content, design, or marketing strategies. SEO is an ongoing process, and continuous monitoring helps you understand what works and what doesn’t.
Monitor and track the impact of any changes you make over time. You can track the performance of important keywords using Carrot’s Keyword Rank Tracker.
By focusing on your Analytics and taking appropriate action, you can systematically enhance your SEO efforts, improve your visibility in search results, and drive more traffic to your website.
When you regularly analyze and interpret the data, you can align your website’s performance with your broader business and marketing goals, ensuring that your online presence supports your overall strategy effectively.
Want feedback? Join us in Carrot’s official Facebook community to ask questions and share insights about the data you’re discovering in your Analytics dashboard.
Learn More:
- Improving Your Google Rankings
- How To Use The Backlink Analysis Tool
- How To Use and Understand Our Search Performance (Google Search Console) Feature
- The Analytics, Data, and Numbers You Should Be Tracking to Gain Consistency in Your Real Estate Business
Close More Deals
with Carrot CRM

Grow your revenue and turn more leads into closed
deals with Carrot’s built-in CRM.
Premium Support
& 1:1 Strategy Calls

Members with our Premium Support Add-On can book
a 1:1 video calls for tech questions & strategic advice.
